The best way to predict the future is to invent it. (Alan Kay)
+36 30 99 00 336
office@arworks.hu
Budapest 1012, Várfok utca 3-5.
Big Data Visualisation in VR
Presenting huge amount of data in an interactive way using VR and HTC Vive
Tasks
Creating the concept
We’ve made it as a POC – still, we’ve prepared a specification
Building the 3D Data Space
Modelling the environment to place the data in it
Integrating Data
Developing 3 different data visualisation method
Programming
Writing the Unity code for HTC Vive
VR Data Visualisation
Big Data Visualisation in VR
Virtual Reality (VR) gives real, actual value to the user in many cases. One of these is Big Data visualisation, where huge amount of data and its analytics has to be presented in an easy to consume and understand way. VR could help a lot in this, since it has many characteristics supporting this – even beyond the basic 360 view:
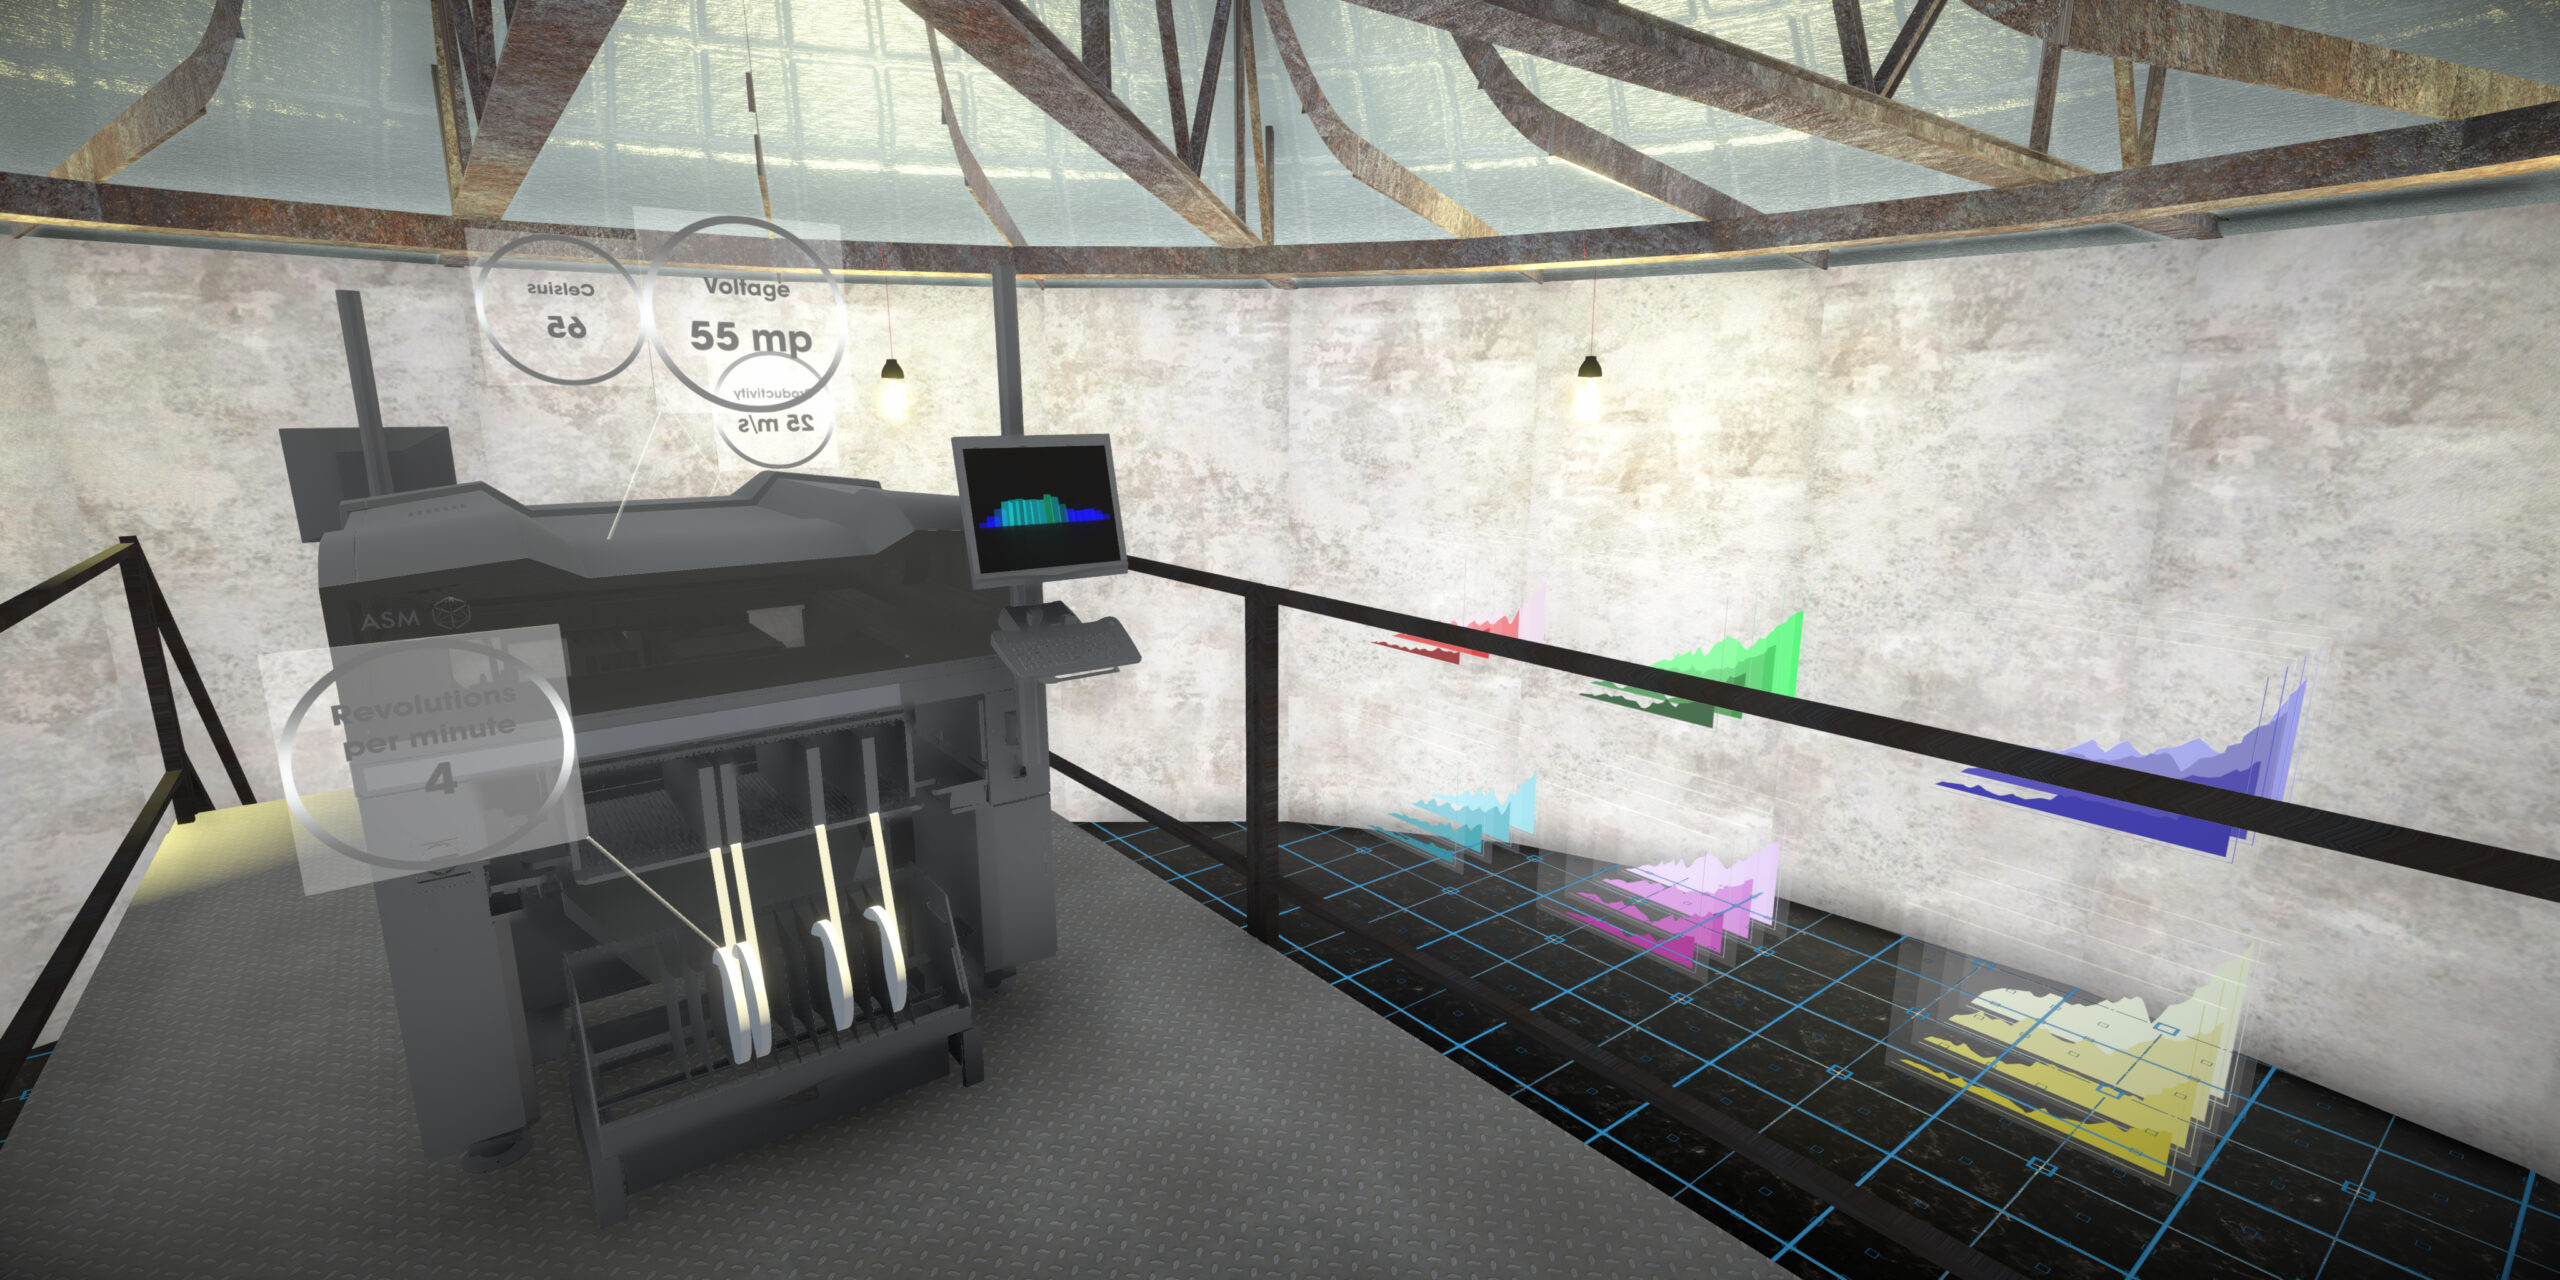
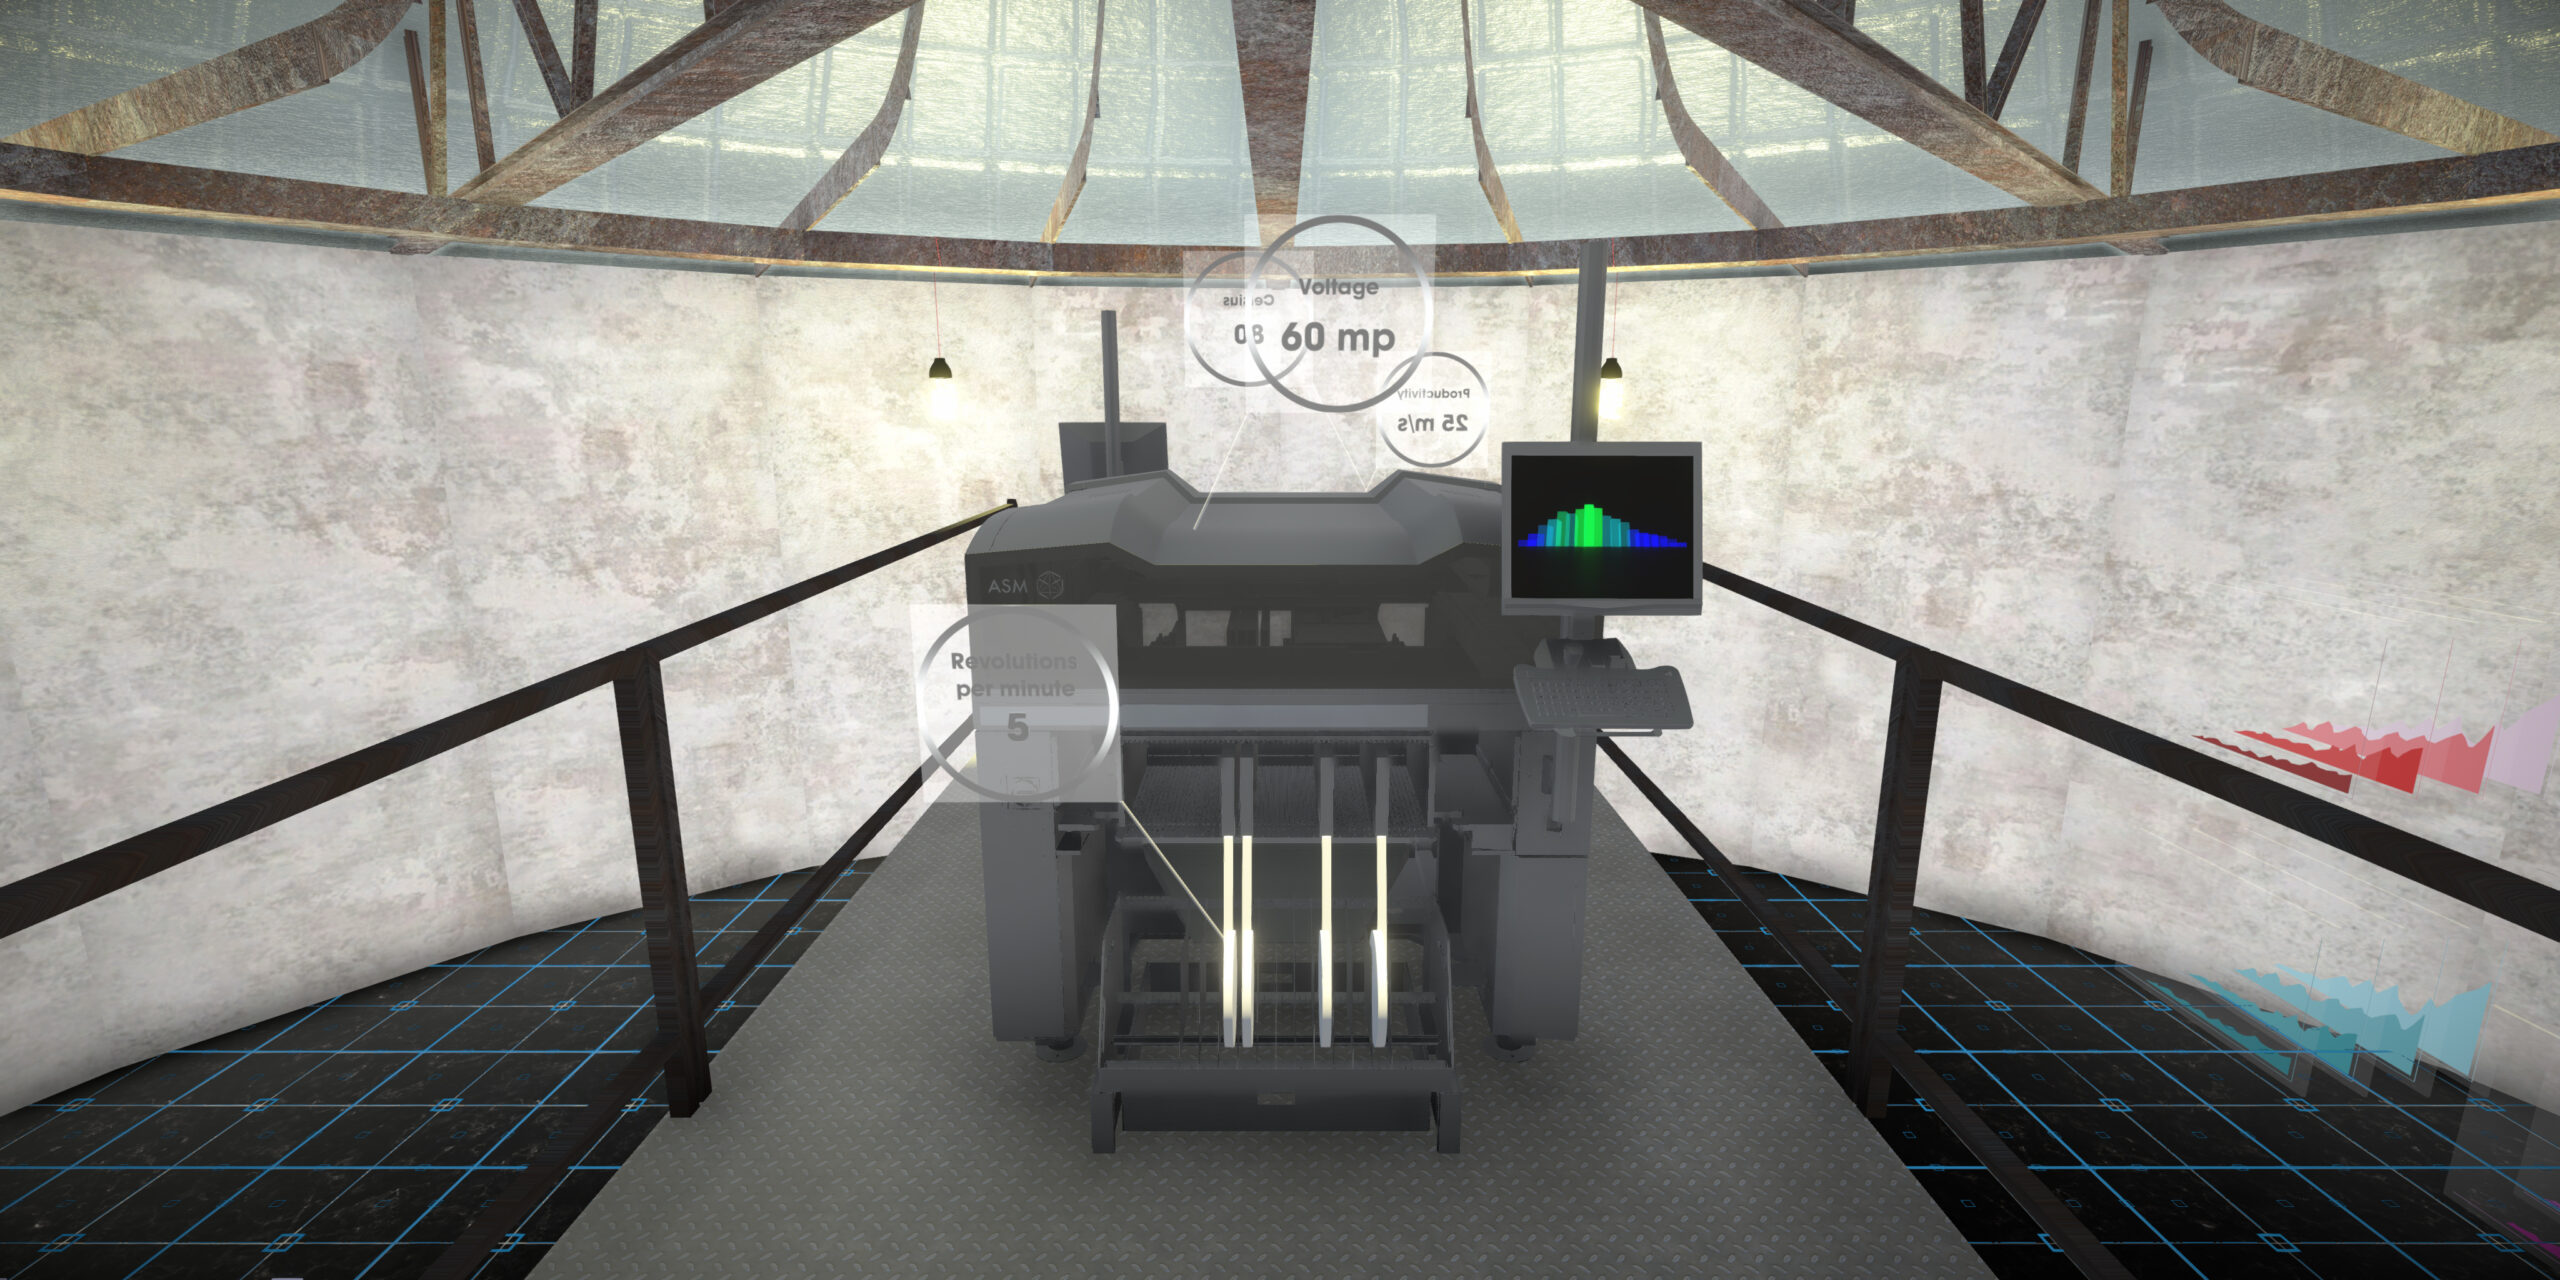
Excluding the external world VR locks out all unnecessary outside stimulus and impulse, the attention kept focused on the actual content
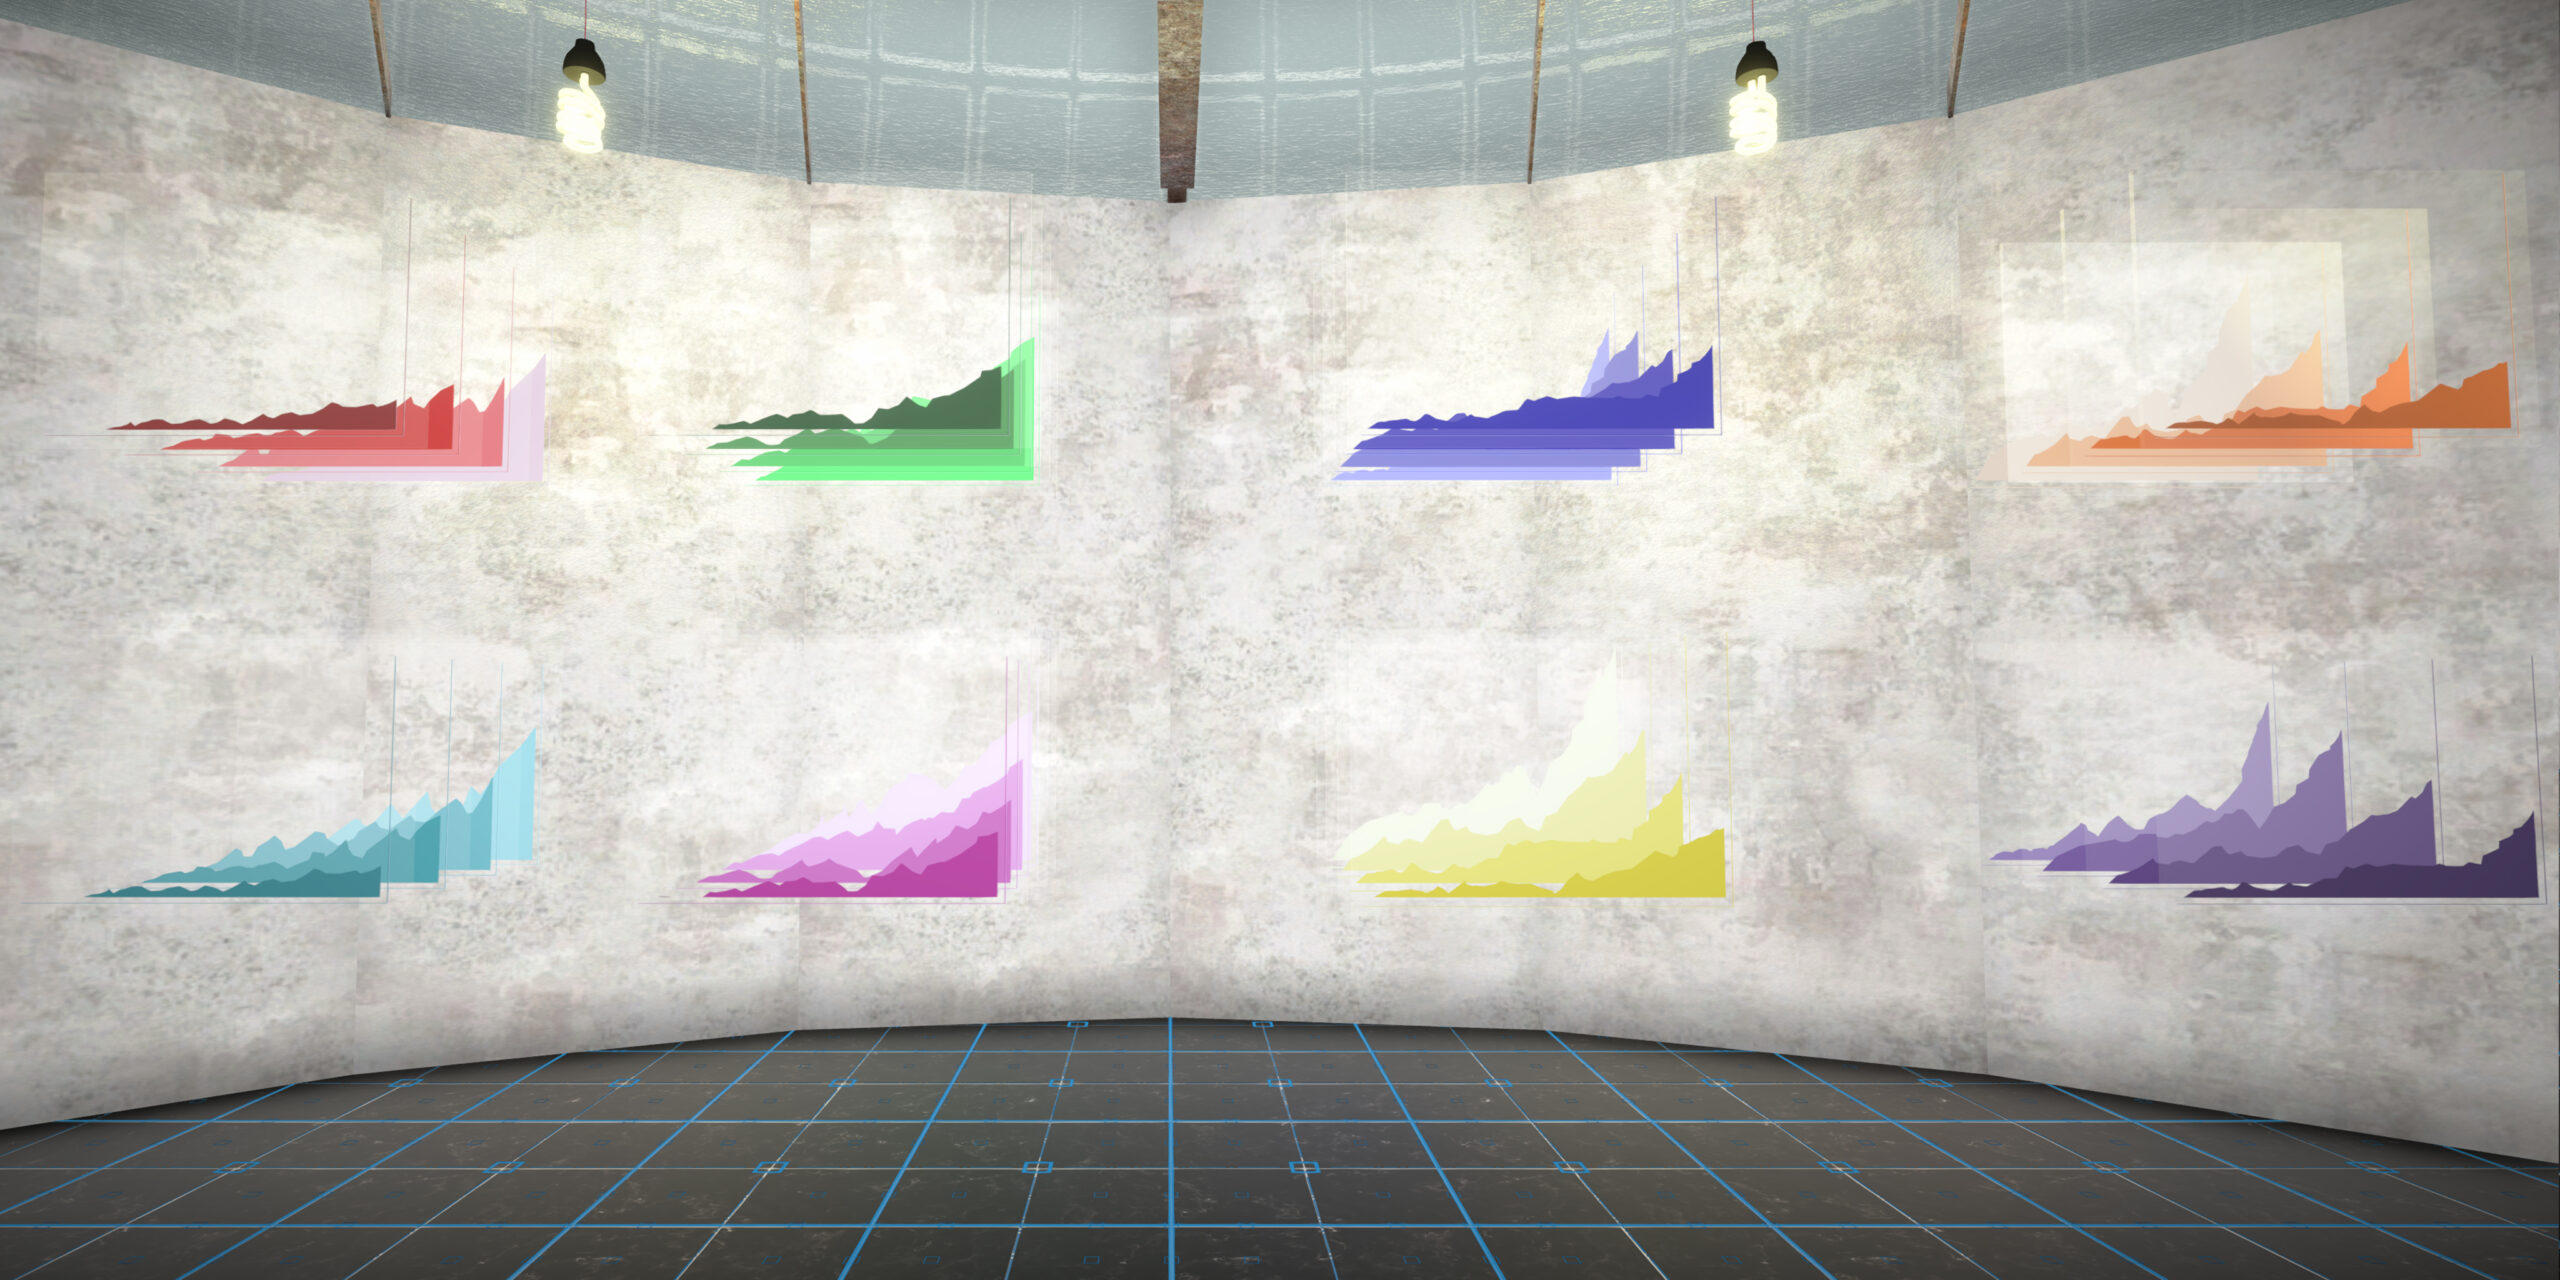
Interactivity The two separate controller of the Vive- one in each hand- helps the user to easily and rapidly interact with the content – let it be selecting, filtering, moving or zooming in the data or any other more complex action.
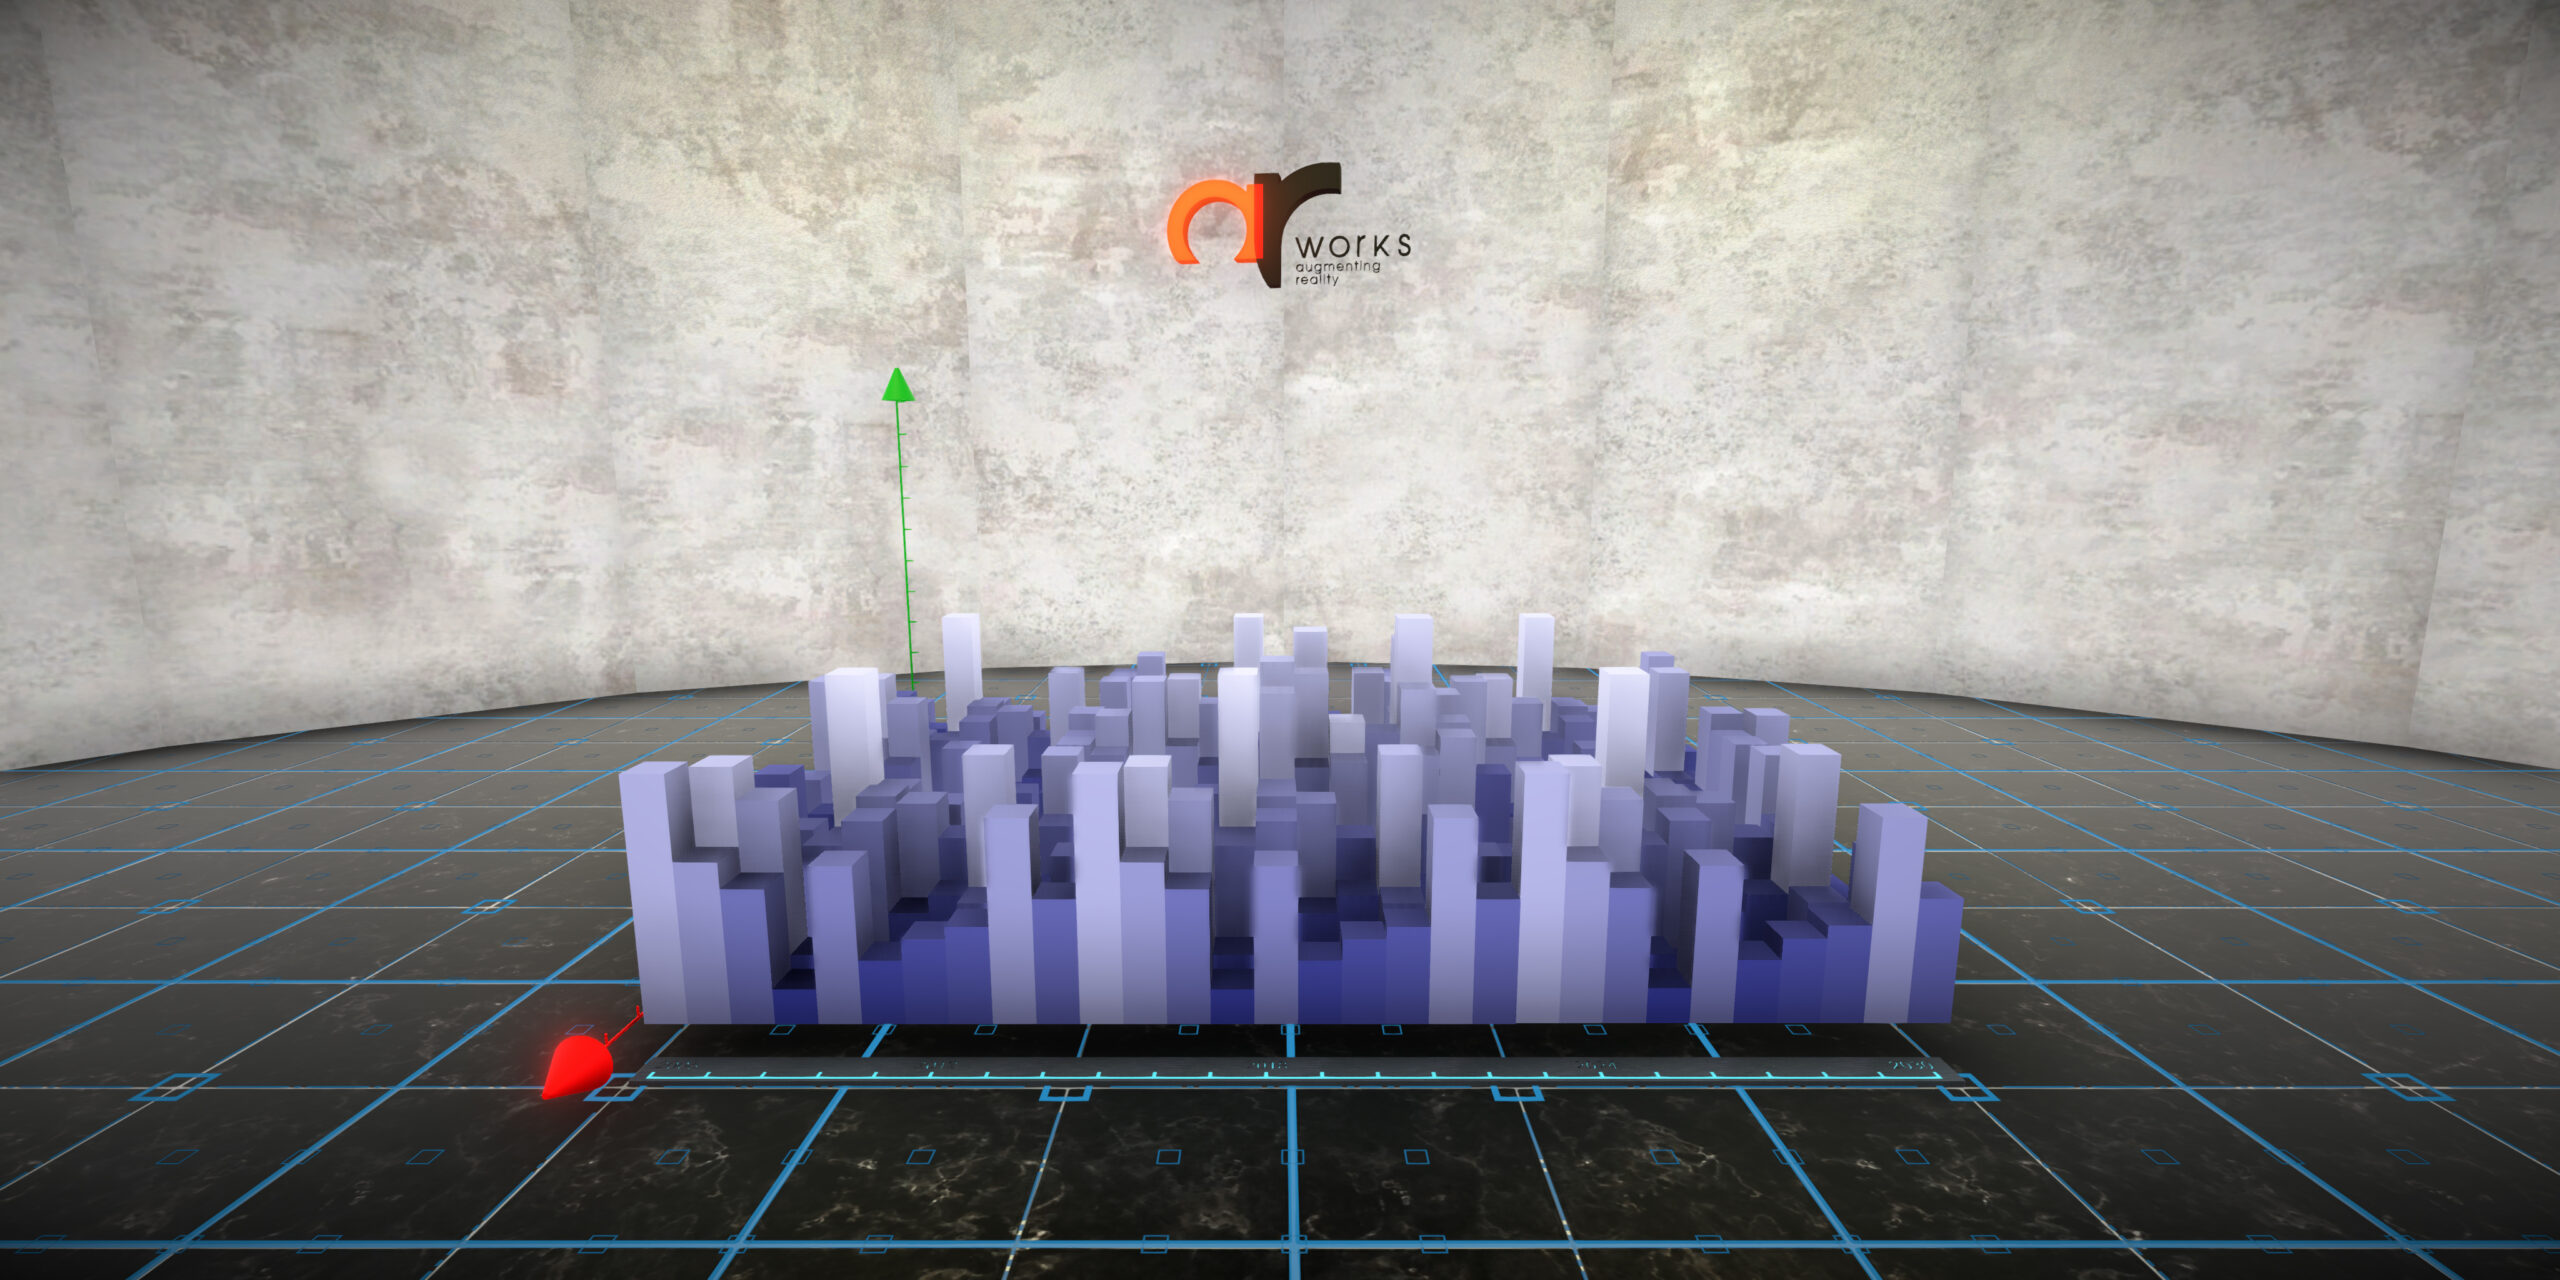
Animation May be the biggest advantage is that instead of static, still charts, changes can be represented by moving, jumping, floating ones which makes the recognition of patterns, trend a lot easier and quicker.
3D VR makes really sense through 3 dimensional representation so the user not just surrounded by the content, but she can wonder in it – so we have a lot more space to show the necessary information.
These advantages are a lot easier to understand based on personal experience of VR and the proof of concept we’ve made.
We have a concept now and we’re looking for a partner who has real big data visualisation need, so our solution can be applied to it.